Home Lab Observability
From a NAS Owner to a Self-Hosting Enthusiast
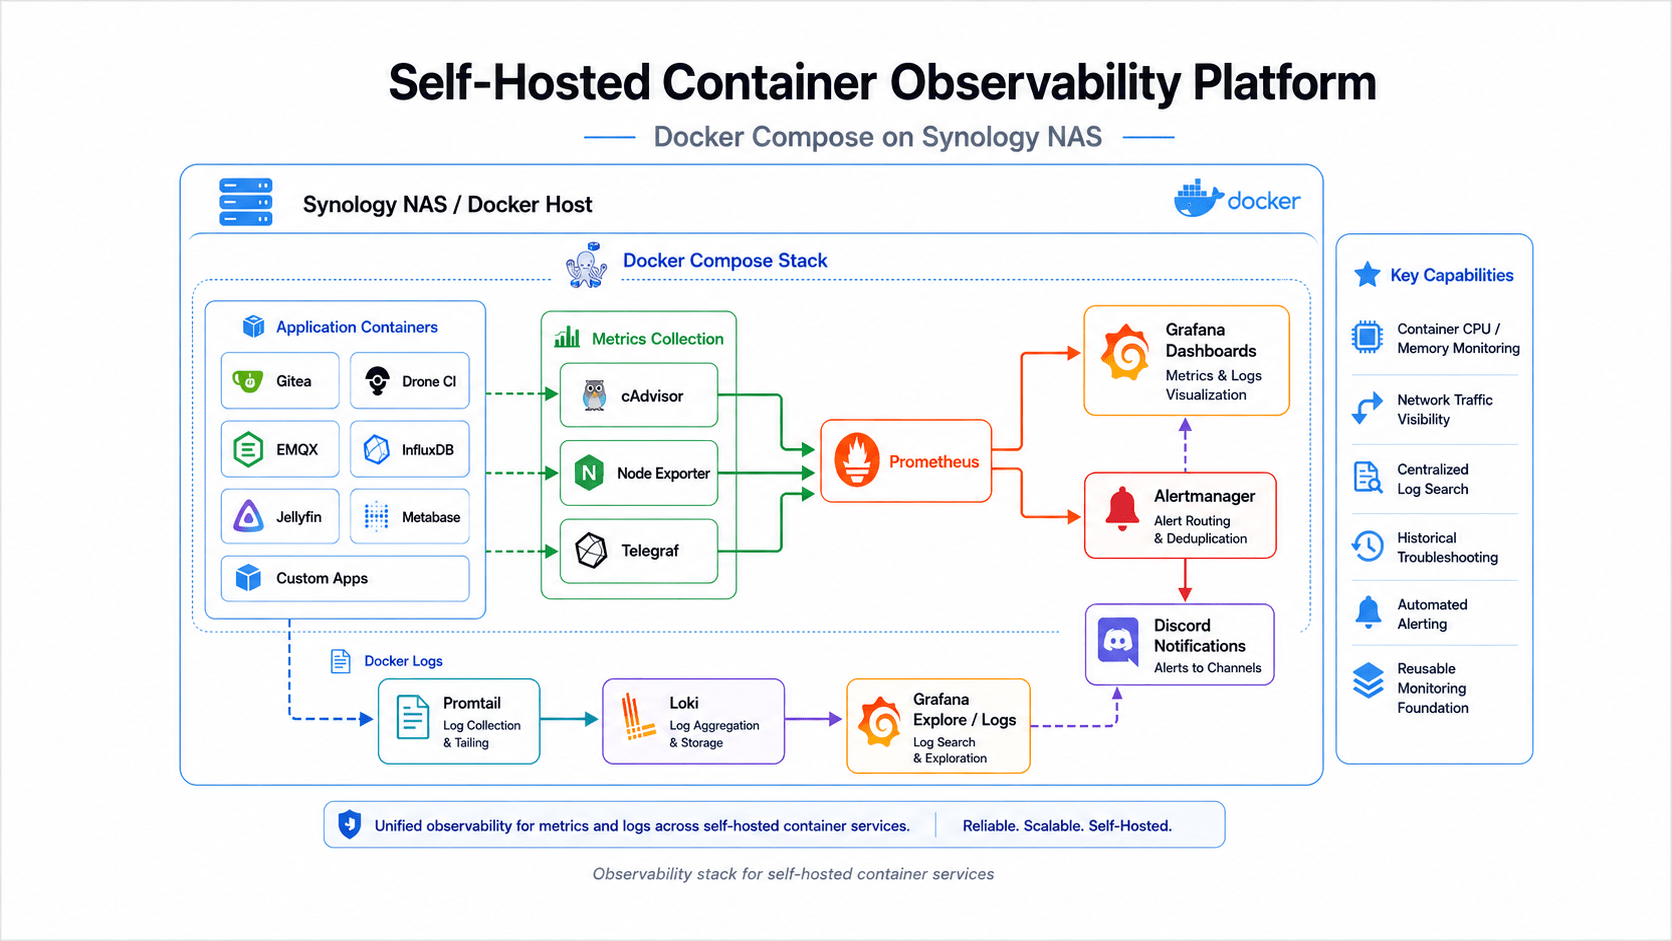
My self-hosting journey began with a Synology NAS for personal storage and backup. After discovering Docker and Portainer, I gradually transformed it into a home lab running source control, CI/CD, monitoring, centralized logging, MQTT messaging, object storage, workflow automation, and custom applications.
Operating these services taught me how to design Docker Compose stacks, manage persistent storage and container networks, troubleshoot runtime issues, and build monitoring and alerting workflows. What began as a personal experiment eventually became a practical environment for learning infrastructure, observability, and reliable backend operations.
Runtime Inspection and Container Troubleshooting
I use Portainer not only to deploy containers, but also to inspect and troubleshoot running services through interactive shells and logs.
For example, after deploying MinIO, I used the MinIO Client (mc) to verify connectivity, create buckets, configure access policies, and test object uploads. Temporary shell commands are used for diagnosis and validation, while permanent changes are applied through Docker Compose, mounted configuration files, or environment variables.
Two-Stage Node Exporter Remediation
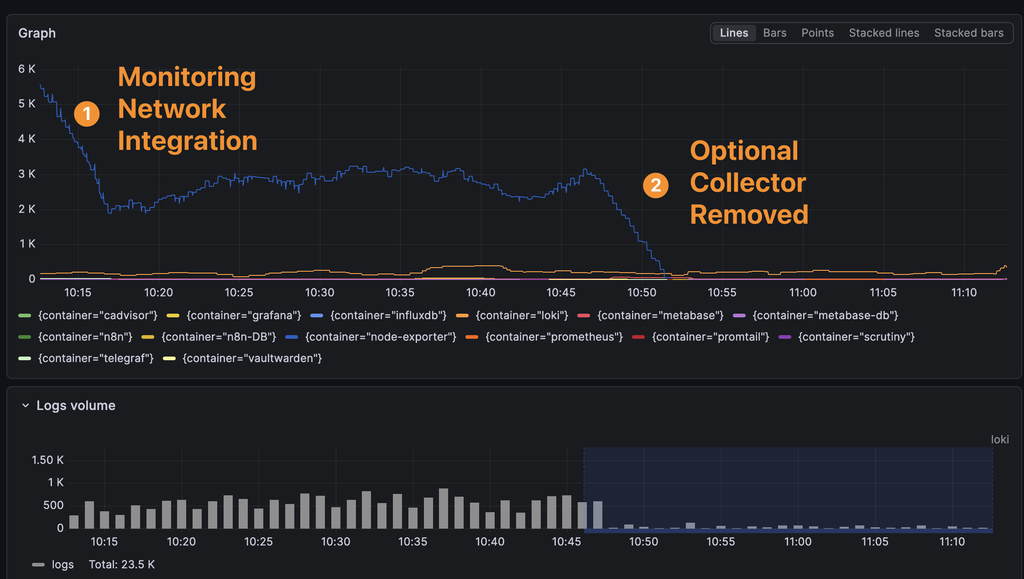
Grafana and Loki revealed two distinct reductions in Node Exporter log volume, corresponding to two deployment improvements.
First, I moved Node Exporter from host networking to the shared monitoring network and exposed port 9100 explicitly. This aligned the exporter with the rest of the Prometheus monitoring stack and simplified service discovery.
A recurring issue remained: Node Exporter produced repeated broken pipe and connection reset by peer messages while serving the /metrics endpoint. I reviewed the enabled collectors, removed an unnecessary optional collector, and recreated the container with a simplified configuration.
After redeployment, the recurring error stream stopped. The five-minute rolling log count returned to zero, providing measurable confirmation that the remediation was effective.
Container CPU Usage Analysis
This Grafana dashboard visualizes CPU usage across all containers running on my NAS. The legend displays both mean and maximum utilization and can be sorted by the Max column, allowing me to quickly identify services responsible for the largest CPU spikes.
Selecting a service name allows me to isolate its time series and investigate when the workload occurred, how frequently it repeated, and whether it represented a temporary burst or sustained resource pressure.
What This Home Lab Demonstrates
This project demonstrates more than the ability to deploy containers. It reflects my experience operating services over time, investigating runtime behavior, diagnosing real infrastructure problems, applying reproducible fixes, and validating outcomes through metrics and centralized logs.